A psychological principle cited in countless bestsellers, workplace workshops, and social media clips might just be a statistical illusion.
Last week, a 2020 article resurfaced on the front page of Hacker News, pulling 110 points and 112 comments in a heated debate. Originating from the McGill University Office for Science and Society, author Jonathan Jarry fell down a literature rabbit hole while attempting to verify a piece of “common sense.” His conclusion was jarring: the widely popularized Dunning-Kruger effect—the idea that “the less you know, the more confident you are”—may be little more than a statistical trick played by data.
What the Effect Originally Claimed
In 1999, Justin Kruger and David Dunning of Cornell University published their landmark paper, Unskilled and Unaware of It, in the Journal of Personality and Social Psychology. Undergraduate participants completed tests on grammar, humor, and logical reasoning, estimated their own test percentile, and compared it with their actual results. The findings revealed that those scoring in the bottom quartile heavily overestimated their abilities (scoring around the 15th percentile while self-assessing at the 60th), whereas top performers slightly underestimated themselves (estimating around the 70th percentile while scoring at the 90th). The following year, the study received the Ig Nobel Prize in Psychology.
Popular science media quickly simplified this finding into a neat curve with four distinct stages: Mount Stupid, Valley of Despair, Slope of Enlightenment, and Plateau of Sustainability—positioning those who “don’t know what they don’t know” right at the peak of Mount Stupid. While this framework spread far and wide, these four stages never appeared in the original paper; they were later creations of internet pop-culture.
Even more frequently overlooked is Dunning’s own perspective. In a response to Jarry, Dunning clarified: “The effect is about us, not about other people.” Its original intent was to explain that anyone, in any domain where they lack proficiency, is prone to overestimating their competence. It was never intended as a license to mock others.
How That Famous Graph Was Drawn
The root of the issue lies in the famous plot itself. In the original experiment, each student yielded two data points: estimated performance and actual score. Dunning and Kruger divided the students into quartiles based on their actual performance, calculated group averages, and plotted two connecting lines.
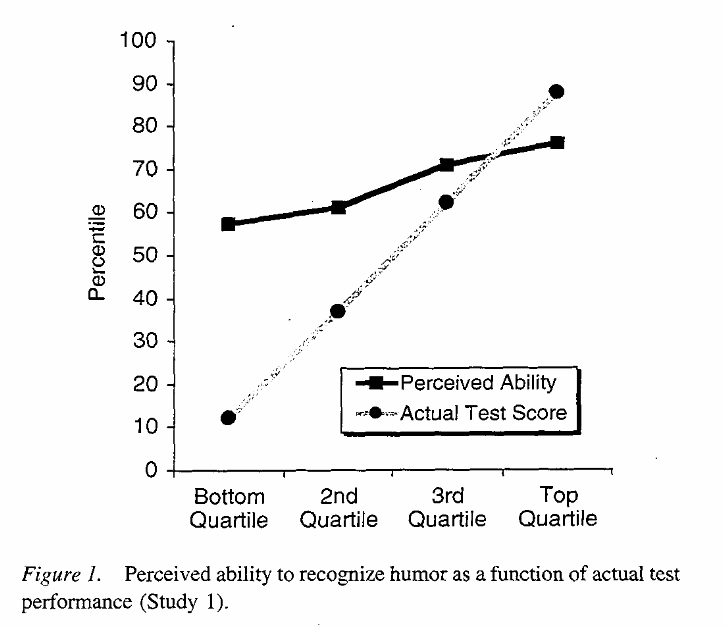
Figure: The “self-assessment vs. actual score” curve from the original paper divided by performance quartiles, showing overestimation at the bottom and underestimation at the top. Source: mcgill.ca
It looked like ironclad proof: low performers simply didn’t realize how poorly they performed.
However, this exact graph can be generated without human subjects at all. In 2016 and 2017, statistician Ed Nuhfer and his team published two papers in the journal Numeracy, demonstrating that purely computer-generated random data produces almost identical plots. The McGill author asked psychologist Patrick McKnight to replicate the simulation. McKnight, a former believer in the Dunning-Kruger effect who regularly taught it in his classes, ran R simulations and changed his mind. Looking back further, Ackerman’s team had already performed similar simulations in 2002, though it drew little attention at the time.
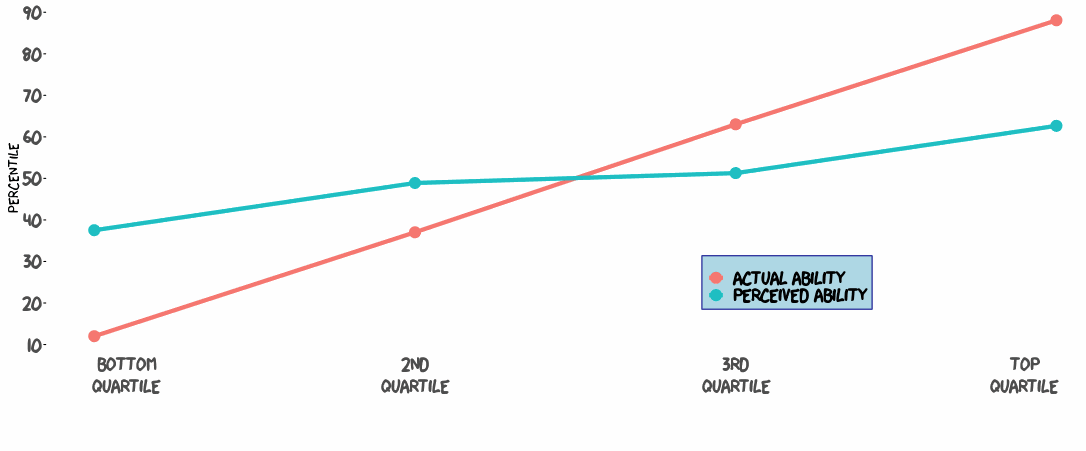
Figure: A curve simulated by McKnight using purely random data, virtually identical to the original paper’s findings. Source: mcgill.ca
Why Random Data Masquerades as a Psychological Law
This phenomenon traces back to regression to the mean.
The clearest analogy is exam performance: if your average score is around 80, but you score 60 on a particular test due to bad luck or poor condition, your score is highly likely to bounce back up next time. Conversely, if luck pushes your score to 95, your next result will likely regress back toward your average. The more extreme an observation is, the larger the random noise component, and the more likely it is to move back toward the mean. The “rookie wall” in sports, second-year slumps, or a fever dropping the next day all stem from this same statistical reality.
The Dunning-Kruger dataset hides the exact same mechanism, operating in reverse: self-assessed scores do not perfectly align with actual scores because self-evaluations contain substantial noise—mood, confidence on that day, or familiarity with specific questions. When measurement noise is high, an almost unavoidable geometric effect emerges: the worst scorers can only err upward (since there is virtually no room to under-predict), while top performers can only err downward. No psychological bias is required—as long as actual skill and self-assessment do not correlate perfectly, plotting the data naturally generates the Dunning-Kruger curve.
A Hacker News commenter summarized it concisely: participants in the lowest quartile cannot under-assess themselves much further, and those in the highest quartile cannot over-assess tennis much higher. As long as the two variables are not perfectly correlated, this curve arises automatically. The only part worthy of genuine investigation is any non-linear pattern beyond the basic statistical curve—and in current datasets, that signal is remarkably weak.
In 2020, Gignac and Zajenkowski published a paper in Intelligence analyzing IQ self-evaluations under more rigorous conditions, titled The Dunning-Kruger Effect Is (Mostly) a Statistical Artefact. When evaluated with appropriate statistical controls, the effect largely vanishes. Their simulations further demonstrated that as measurement error increases, the apparent Dunning-Kruger effect becomes stronger. Science rarely encounters valid phenomena where “greater measurement error yields a stronger conclusion,” which in itself serves as a major red flag.
The Debate Continues: Ammunition on Both Sides
Nuhfer and Gignac are not the only voices questioning the effect, but defenders of the theory have countered with their own studies, keeping the five-year debate alive:
| Skeptics | Defenders |
|---|---|
| Nuhfer et al. (2016/2017): Random data replicates the curve | Dunning’s team: 2002 & 2008 studies tested regression to the mean directly, arguing the effect persists after controlling for noise |
| Ackerman et al. (2002): Simulations show similar artificial curves | Jensen et al. (2021): Two studies with >3,500 subjects supported the metacognitive explanation |
| Gignac & Zajenkowski (2020): Effect is (mostly) a statistical artifact | Dunkel et al. (2023): Re-analysis using alternative methods found a statistically significant, albeit tiny, effect |
| Hiller (2023): Challenged Gignac & Zajenkowski’s data processing methods | Dunning (2025): Published a defense in the British Psychological Society publication |
The closest current consensus settles on a far less dramatic middle ground: the Dunning-Kruger effect may exist, but its magnitude has been severely exaggerated. As a universal rule asserting that “most people lack self-awareness,” it does not stand up to scrutiny. As a phenomenon where a “small subset of people severely overestimate their skills,” some evidence remains—in Nuhfer’s dataset, only about 5–6% of participants truly fit the “unskilled and unaware” profile.
What This Means for Everyday Life
First, stop using “Dunning-Kruger” as a casual insult. When someone confidently states something incorrect, it is not necessarily the Dunning-Kruger effect—it might simply be overconfidence bias or the “better-than-average” illusion, where over 80% of drivers rate their skills as above average. These psychological biases are well-established, and psychology does not need the Dunning-Kruger effect to explain the existence of confident foolishness.
Second, Dunning’s observation that “this effect is about us” remains the most valuable takeaways from the discussion. In domains where you lack expertise, your internal self-assessment is the least reliable indicator. That is precisely why objective external feedback—exam scores, medical tests, peer reviews, and market validation—is vastly superior to “feeling like you understand.”
Third, maintain healthy skepticism toward psychological common sense that feels “too satisfying.” The Dunning-Kruger effect went viral for two decades because its narrative is immensely appealing: it gives everyone a justification to look down and say, “Look at that person who doesn’t know what they don’t know.” The more comforting a conclusion feels, the more we should ask: is that really what the raw data says?
The Dunning-Kruger legend of “ignorance breeds confidence” has been significantly weakened under rigorous statistical re-examination. Yet as an ongoing twenty-year scientific debate, it is far from closed. The debate between psychologists and statisticians offers a timeless lesson: the prettier a conclusion appears, the more imperative it is to inspect the underlying raw data. That is why a 2020 article can still trigger 112 passionate comments on Hacker News today.
Reference Links:
- McGill OSS: The Dunning-Kruger effect may just be a data artefact
- HN Discussion (item?id=49160437)
- Kruger & Dunning (1999): Unskilled and Unaware of It
- Gignac & Zajenkowski (2020): The Dunning-Kruger effect is (mostly) a statistical artefact
- Nuhfer et al. (2016/2017): Numeracy journal papers
- Dunkel et al. (2023): Reevaluating the Dunning-Kruger effect
- Dunning (2025): The Dunning-Kruger effect and its discontents (British Psychological Society)