350,000 Drives Deliver a 1.73% Annualized Failure Rate
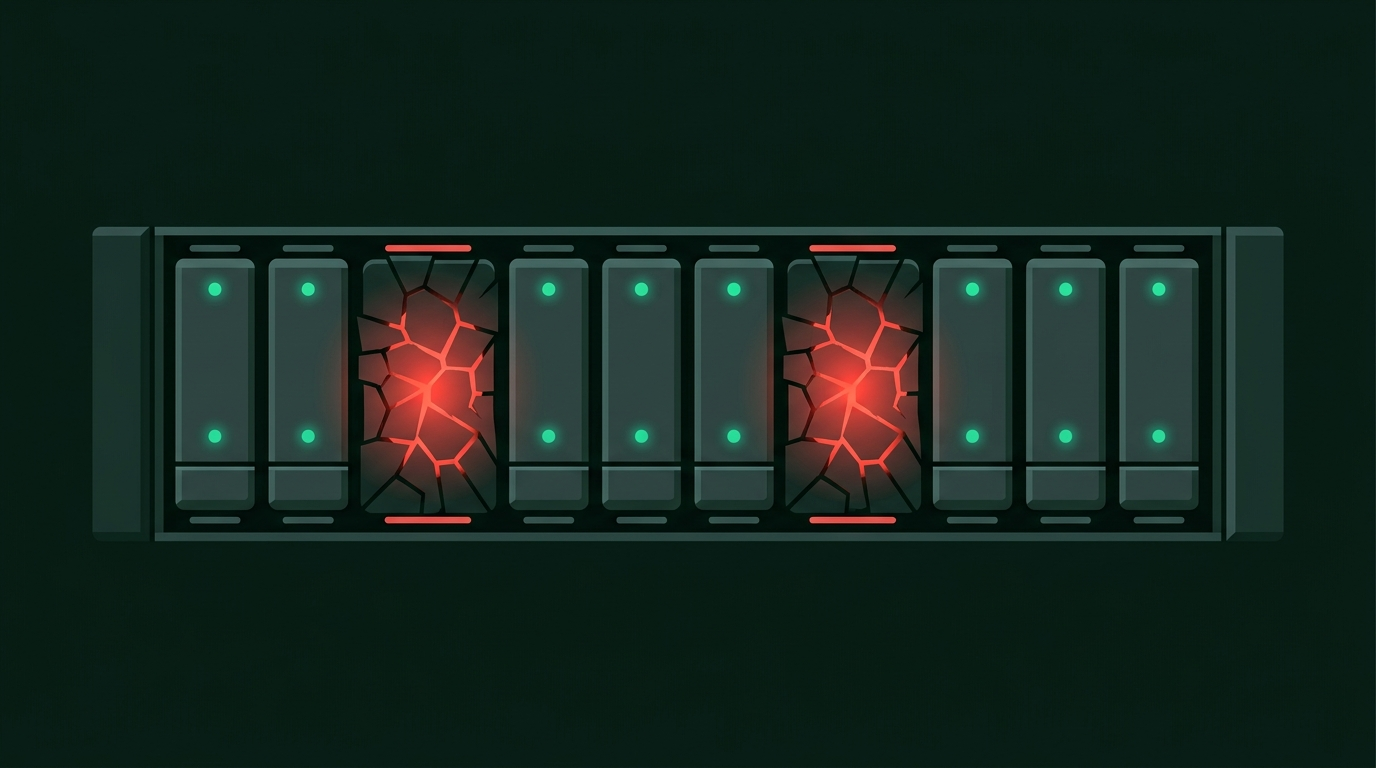
In late September 2026, Backblaze published its Drive Stats report for Q2 2026, and a headline metric immediately set off alarm bells: the quarterly annualized failure rate (AFR) climbed to 1.73%. This was not merely a subtle fluctuation; it marked the highest quarterly failure rate recorded in quite a while. Across the quarter, 354,415 hard drives included in the analysis accumulated 31,553,350 drive days and logged 1,498 actual failures. In data center operations, every accumulated drive day represents ongoing operational expense, and every failed drive puts storage redundancy mechanisms through a live test. A baseline of over 350,000 drives cuts straight through vendor marketing claims, exposing the raw wear-and-tear trajectory of production hardware. As failure rates climb, drive replacement runs in the server aisles inevitably become a more frequent nightly routine.
Many observers instinctively blame rising failure rates on poor quality control. Yet 13+ years of continuous monitoring tell a very different story: among the 31 drive models tracked this quarter, 10 exceeded an AFR of 3.0%. These drives, sitting in the twilight of their operational lifecycles, disproportionately pulled up the fleet-wide average.
High failure rates are fundamentally the symptom of an aging fleet in a cloud data center. Two legacy HGST models—a 4TB drive and an 8TB drive that served for nearly nine and eight years, respectively—were formally retired this quarter. At the same time, for the second consecutive quarter, no brand-new drive models were deployed into the pool, irreversibly pushing up the average age of the storage cluster. As aging drives approach retirement, their failure rates surge, reaffirming that hard drives are consumable assets that undergo accelerated wear over time.
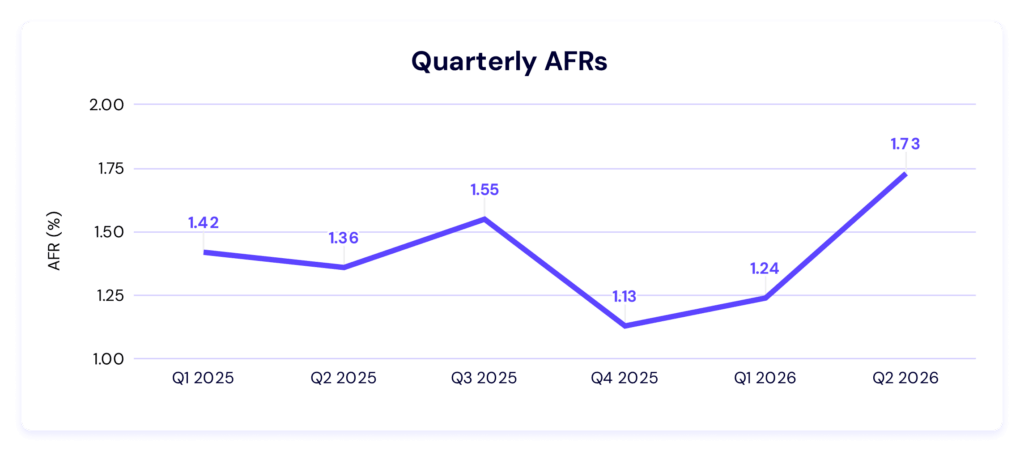 Figure: Quarterly annualized failure rate shows a noticeable recent uptick. Source: Backblaze Drive Stats
A Tenfold Gap in the Same Form Factor
In consumer markets, purchasing decisions often boil down to capacity and form factor. Under the scrutiny of hyperscale cloud storage, however, surface-level specifications provide little protection. In the 16TB bracket, for instance, Seagate’s ST16000NM001G achieved a quarterly AFR of 0.65%, while Toshiba’s MG08ACA16TA recorded 1.01%. Both workhorse models, each numbering over 30,000 active drives, maintained a remarkably resilient baseline.
Yet within the very same 3.5-inch category, HGST’s 12TB HUH721212ALN604 posted a quarterly AFR of 7.63%. Across models of similar generation and capacity sitting on the same datacenter shelf, failure rates diverged by more than tenfold. Buying a hard drive means committing not just to a label, but to a specific production batch and its underlying manufacturing processes.
A quartile analysis flagged three glaring high-end outliers: beyond the 7.63% noted above, Seagate’s ST10000NM0086 (10TB) spiked to 9.33%, and Seagate’s ST14000NM0138 (14TB) reached 8.26%. The latter two models had modest deployment pools of just 965 and 1,235 drives, respectively—a drop in the ocean compared to the 350,000-drive total. They generated near-ten-percent AFRs because accumulated drive age reacted with a small statistical denominator, where a handful of drive failures can instantly double the calculated rate.
The Sample-Size Trap Behind Zero-Failure Leaderboards
On paper, Seagate looked unassailable this quarter, sweeping the zero-failure leaderboard. The ST8000NM000A, ST12000NM000J, and ST14000NM000J recorded zero failures across the three-month period, while their 16TB counterpart logged just a single failure. Surrounded by drives with failure rates exceeding 3%, these models seemed astonishingly pristine.
Beneath the surface, however, lies a classic statistical trap. None of these models qualified for the lifetime reliability table, which requires a minimum of 500 drives and 100,000 lifetime drive days. One of these zero-failure models fielded a mere 171 drives. When a test sample is compressed to a few hundred units over three months, seeing zero failures is an expected probabilistic outcome rather than proof of exceptional endurance.
Meaningful failure rate calculations require both a sustained time horizon and massive sample sizes. Touting zero failures without tens of millions of drive days of operational history is like claiming to be a master gambler after winning a single spin of roulette. Small cohorts routinely produce artificial statistical anomalies, which is precisely why Backblaze enforces strict sample thresholds on its lifetime tables. Equating the three-month track record of several hundred drives with the proven reliability of tens of thousands is a self-deceptive game.
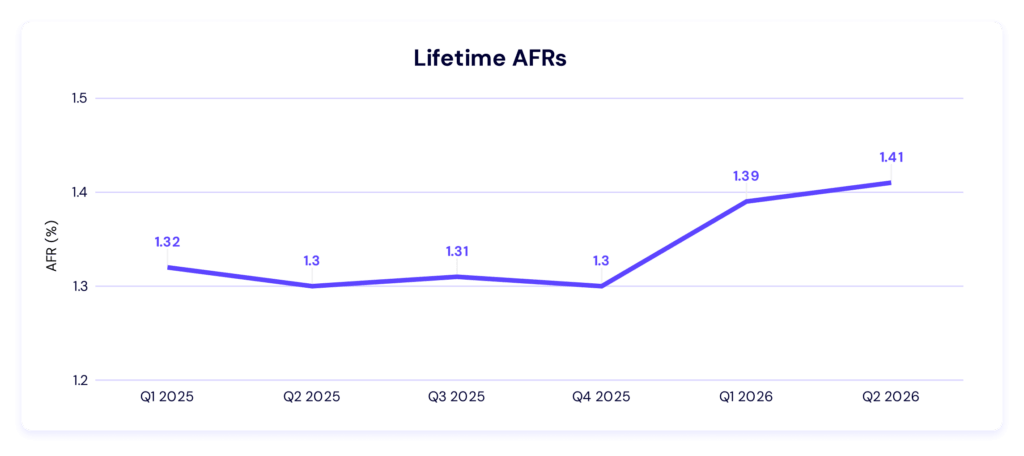 Figure: Real-world drive performance over extended lifespans. Source: Backblaze Drive Stats
Density Demands: SMR Shifts Hardware Complexity into Software
While legacy drives continue to age, the expansion of modern server racks marches on. Drives of 20TB and above now represent more than 25% of Backblaze’s tracked dataset, with new deployments concentrating steadily at the high-capacity end. Western Digital recently announced a 40TB UltraSMR drive and mapped out an industry roadmap targeting 100TB by 2029. This explosive growth in storage density is reshaping data center infrastructure from the ground up.
Shingled Magnetic Recording (SMR) plays a pivotal role in this capacity leap. Conventional Magnetic Recording (CMR) arranges tracks side-by-side with guard bands in between. SMR, by contrast, overlaps tracks like shingles on a roof. Because write heads are physically wider than read heads, overlapping consecutive tracks leaves sufficient track width for the read head to retrieve data, squeezing 10% to 25% more raw capacity from each platter.
This architectural shift triggers immediate ripples throughout the software stack. SMR is notoriously sensitive to workload patterns: sequential and append-only writes flow effortlessly, but frequent random rewrites demand extensive background track reorganization and garbage collection. Whether managed directly by the drive firmware, made host-aware, or managed entirely by host applications, SMR obliges operating systems and storage engines to adapt. Trading rack space for raw density inevitably pushes underlying mechanical complexity into the software layer.
Glass Substrates and the 100TB Horizon
Areal density is pushing hard against fundamental physical boundaries. Heat-Assisted Magnetic Recording (HAMR) addresses this by using a microscopic laser pulse to briefly heat the recording platter, enabling write heads to record onto smaller, magnetically stable grains. Crucially, HAMR and SMR tackle orthogonal physical bottlenecks. To achieve the 100TB milestone, drive manufacturers plan to stack both technologies onto the same platters.
To withstand the localized thermal cycles and extreme mechanical tolerances of HAMR, conventional aluminum-alloy platters are being phased out. Glass substrates have long been standard in 2.5-inch HAMR drives and are increasingly standard in high-capacity 3.5-inch platforms. Replacing the mechanical foundation of the drive is an engineering overhaul of the first order, signaling that aluminum has exhausted its physical potential. The data center race has shifted into materials science: as per-drive capacity scales toward triple digits, every incremental gain in density demands finer thermal control and more robust mechanical stabilization.
Today, Backblaze’s 350,000-drive fleet does not yet include SMR drives. However, the company has stated that as these new technologies enter deployment, they will be tracked and evaluated under their own headings. Regardless of how many glass platters are packed inside a sealed drive casing, cloud operators face one invariant mandate: maintaining stable reliability as hardware ages. When 100TB glass drives become standard, data durability will no longer rest solely on individual component resilience, but on whether distributed storage engines can absorb the underlying mechanical turbulence.
Reference Links:
- Backblaze Drive Stats Report