The 2025 global electricity ledger reveals a staggering divergence. Solar photovoltaic (PV) capacity expanded by an unprecedented 510 GW (gigawatts, a standard utility-scale power metric) in a single year, while total installed nuclear capacity grew by a net 1.5 GW to reach 399.5 GW. When counting only actively operating reactors, nuclear capacity actually suffered a net contraction of 0.5 GW, declining to 368.6 GW. Within twelve months, the volume of newly deployed solar generation capacity outstripped nuclear power’s net additions by roughly three hundred-fold.
On September 29, 2026, eighteen interdisciplinary authors released the World Nuclear Industry Status Report 2026 (WNISR 2026) in Istanbul, featuring a foreword by former Japanese Foreign Minister Taro Kono. The landmark report documents a watershed moment in the history of electrical power: wind generation overtook nuclear on a monthly basis for the first time in March 2025, followed immediately by solar in April 2025. Between March 2025 and June 2026, either wind or solar individually eclipsed nuclear output every single month; across March, April, and May 2026, wind and solar each generated more electricity globally than the entire operating nuclear fleet simultaneously.
Solar power surged past nuclear largely through the compounding advantages of assembly-line manufacturing and modular deployment. Where nuclear truly lost ground was in schedule discipline and capital control: all 16 nuclear reactors grid-connected between 2023 and 2025 suffered project delays, averaging an overrun of 10.9 years. Standardized silicon wafers shipped by the shipping container stand in stark contrast to custom megaprojects poured from on-site concrete, creating a delivery speed disparity of two orders of magnitude.
Solar Expands by 510 GW in One Year as Nuclear Share Drops to a 45-Year Low
Examining the macro electricity landscape, renewables and nuclear power are traveling along opposite trajectories. In 2025, global solar PV capacity grew by 510 GW to reach 2,383 GW—a 27% year-over-year increase. Wind power added 159 GW over the same period, bringing its cumulative total to 1,291 GW, up 14%. Solar and wind have harnessed the standardized expansion curve of mass manufacturing, enabling panels and turbines straight from the factory floor to be assembled and grid-connected rapidly across deserts and rooftops.
Meanwhile, the existing nuclear fleet is struggling under an accelerating wave of decommissioning. Only 4 new nuclear reactors were commissioned worldwide throughout 2025, while 7 units shut down permanently—marking the first net decline in the global operating reactor count since 2021. As of July 1, 2026, exactly 411 operational reactors across 31 countries provided a collective capacity of 374.7 GW, with an additional 30 units in long-term outage. The pace of aging reactor retirements has now caught up with and overtaken new reactor grid connections.
Stagnant capacity expansion shows up directly on electric meters. Global nuclear electricity generation reached 2,703 TWh (terawatt-hours, billions of kilowatt-hours) in 2025, nudging up by just 1.1%. Nuclear’s share of worldwide electricity generation slid to 8.8%—a 45-year low and barely half of its 1996 peak of 17.5%. The overwhelming bulk of annual incremental global power demand is now absorbed by rapidly scaling wind and solar installations.
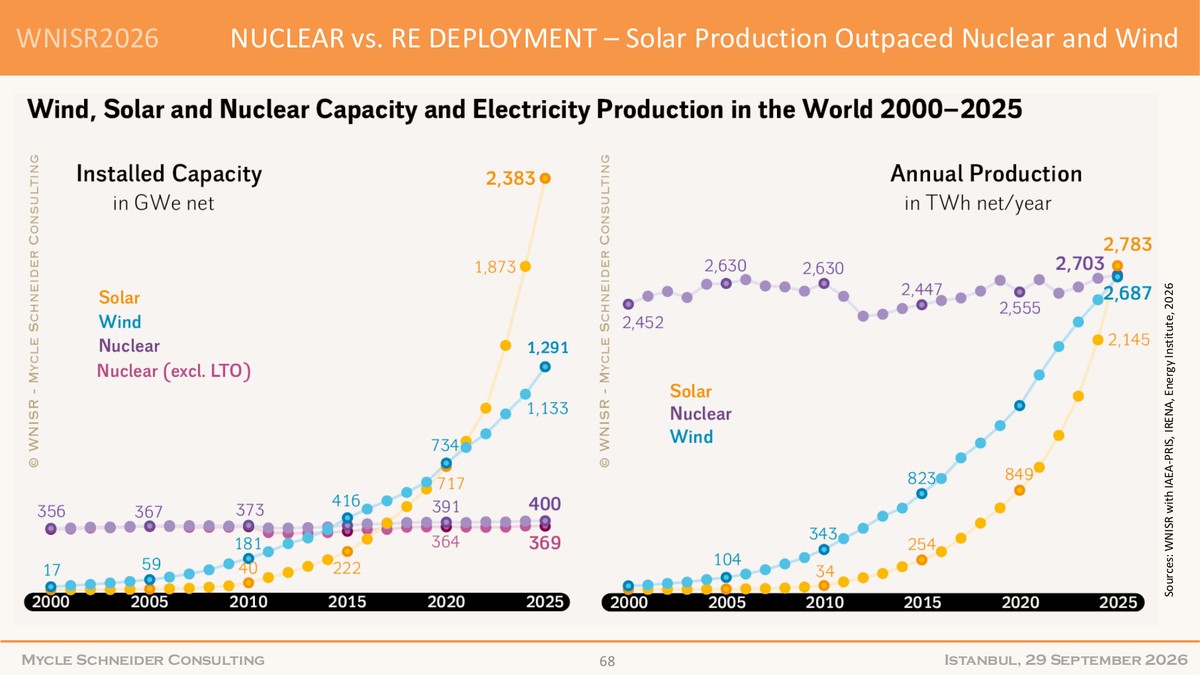 Figure: Page 67 of the WNISR 2026 Global Launch Media Briefing illustrates monthly solar generation overtaking the nuclear and wind trajectories. Source: WNISR 2026 Global Launch Media Briefing (p. 67)
All 16 Grid-Connected Units Delayed, Averaging a 10.9-Year Overrun
The root cause of nuclear energy’s capacity stagnation lies buried in construction site schedules worldwide. Among the 16 nuclear reactors brought onto grids globally between 2023 and 2025, not a single one met its original completion schedule, accumulating an average delay of 10.9 years. Out of 13 units initially scheduled for delivery in 2025, only 4 were actually commissioned by year’s end. On-time delivery has become an elusive rarity in modern nuclear infrastructure projects.
Several multi-decade megaprojects have dragged into generational marathons. Slovakia’s Mochovce Unit 4 has been under construction for over 40 years since initial site work commenced. Unit 2 of Iran’s Bushehr plant, which first broke ground in 1976, has yet to cross the commercial finish line. From initial licensing to energization, an individual facility frequently spans the entire career lifespans of two generations of engineers.
Such chronic delays stem directly from nuclear power’s stringent physical and regulatory safety boundaries. Reactor containment structures demand thousands of tons of heavily reinforced specialty concrete, while primary coolant loops and reactor pressure vessels involve specialized, high-tolerance forging. Every single field weld must clear rigorous non-destructive testing and independent regulatory scrutiny. When mid-construction design modifications or supply-chain bottlenecks occur, schedules slip by years. Prolonged delays stretching past a decade drain project liquidity, and crushing financing costs have made Western electric utilities deeply hesitant to greenlight new gigawatt-scale builds.
 Figure: Modular utility-scale ground-mounted solar farm arrays; standardized components bypass lengthy on-site heavy civil engineering. Source: Hans Ott / Unsplash (via pv magazine)
Two Decades of Retirements Cancel Out New Builds: China and Russia Account for 90% of Starts
Zooming out over the 2006 to 2025 window exposes a pronounced geopolitical divergence in the global nuclear landscape. Across those twenty years, 104 nuclear reactors were started up worldwide while 106 were permanently shut down, resulting in a net wash between additions and retirements. China alone connected 53 new reactors over this period with zero closures; excluding China, the rest of the world experienced a net decline of 55 reactors.
Capacity and generation metrics tell the identical story. Over the past twenty years, net global nuclear capacity increased by 21.5 GW. China contributed an increase of 52.3 GW on its own, whereas capacity across all other nations contracted by a net 30.7 GW. In 2025, nuclear generation grew by 1.1% globally, driven by a 7.6% surge in China that masked a 0.2% decline throughout the rest of the world—leaving non-Chinese nuclear output below its 2006 baseline. With legacy Western plants reaching end-of-life retirement, the engine of nuclear expansion has consolidated almost entirely into a handful of state-backed programs.
There are currently 73 nuclear reactors under construction worldwide—the highest total since 1987—with roughly 90% situated in Asia or Eastern Europe. China leads with 37 units under construction; Russia is involved in 29 projects, including 22 located outside Russian borders. In 2025, 12 construction starts marked the highest annual total since 2010, featuring 9 in China, 2 in Russia, and 1 in South Korea. Between 2020 and 2025, the 52 construction starts launched globally came almost exclusively from China and Russia. Yet even in China, where nuclear construction is at its zenith, 2025 solar installations hit an unprecedented 314 GW compared to nuclear’s 2.5 GW. Unbroken construction pipelines have preserved China’s nuclear supply chain, but on the open grid, solar capacity expansion continues to run two orders of magnitude faster.
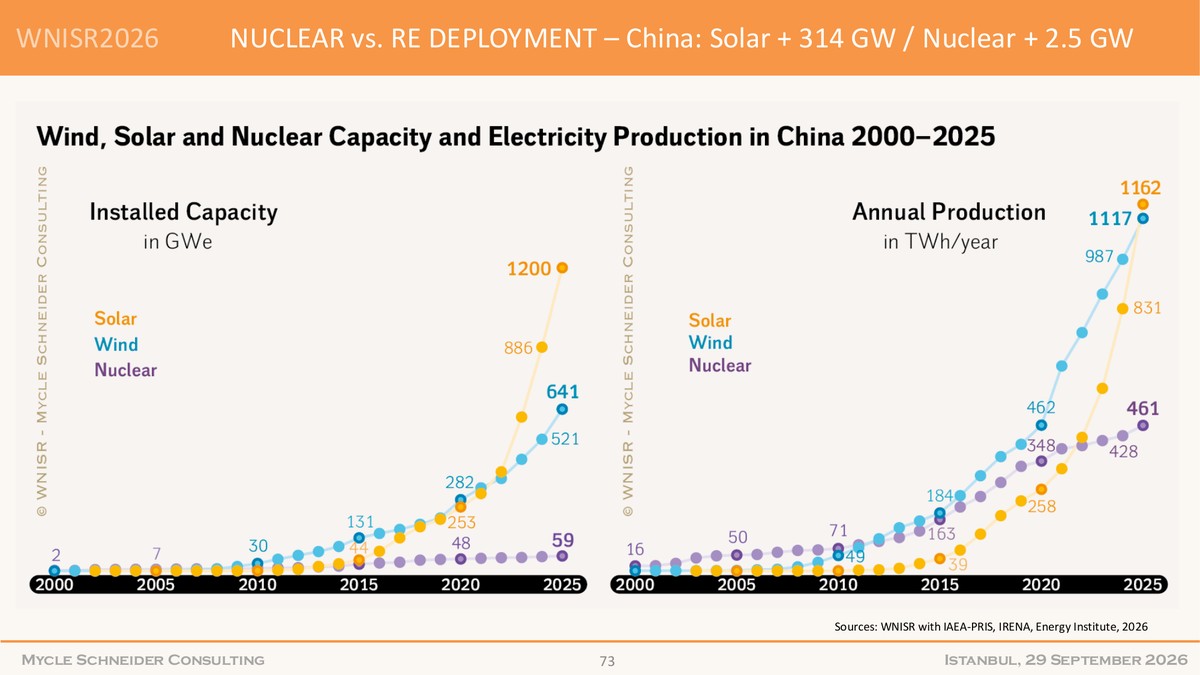 Figure: Page 72 of the WNISR 2026 Briefing compares China’s 2025 incremental electricity additions, where 314 GW of new solar dwarfed 2.5 GW of nuclear additions. Source: WNISR 2026 Global Launch Media Briefing (p. 72)
Small Modular Reactors Grow in Size as Capital Markets Vote with Their Feet
Hoping to bypass the construction mire of large-scale gigawatt power stations, the nuclear industry has turned heavily toward Small Modular Reactors (SMRs—defined as units under 300 MW designed for factory fabrication and rapid site assembly). The foundational premise was that smaller footprints and factory series production could eliminate field delays. Real-world commercial deployment, however, has proven significantly more arduous than the pitch decks suggested.
To spread high fixed development costs across more output, developers have steadily increased SMR capacities, pushing many designs past the 300 MW threshold. The UK committed £2.6 billion to three Rolls-Royce SMR units at Wylfa, yet a Final Investment Decision is not anticipated until 2029, and each unit is rated at 470 MW—well beyond the traditional SMR category. While Canada broke ground in 2026 on GE-Hitachi’s BWRX-300 project, research indicates that certain SMR concepts generate between 2 to 30 times more radioactive waste per unit of electricity than conventional light-water reactors. When small reactors scale up in search of unit economics, they risk slipping back into the familiar cycle of custom on-site construction and protracted regulatory reviews.
Secondary capital markets, notoriously sensitive to delivery risks and execution timelines, have reacted skeptically to extended payback horizons. Advanced nuclear technology firm Holtec was forced to shelve plans for an initial public offering targeting nearly $1 billion. Another high-profile nuclear developer, Fermi, has seen its equity valuation collapse by roughly 80% since listing in October 2025. Private capital demands predictable milestones; decade-long lead times do not easily align with high-multiple growth stories.
A 180 GW Accounting Gap, and Battery Storage Closes the Final Resilience Gap
The conclusions of WNISR 2026 have sparked spirited pushback across the energy sector. Industry advocates have long noted the report’s critical stance toward nuclear power, arguing that it overemphasizes schedule setbacks while undervaluing nuclear energy’s role as firm baseload power—delivering round-the-clock, weather-independent stability to high-demand grids. Backers highlight the 73 reactors currently under construction worldwide and multi-billion-pound government commitments as clear proof of sovereign appetite for long-term nuclear baseload.
Accounting methodologies also introduce substantial reporting variations. The International Energy Agency Photovoltaic Power Systems Programme (IEA PVPS) estimated global solar additions at roughly 690 GW in 2025—about 180 GW higher than the 510 GW reported by WNISR. This 180 GW gap reflects the classic divergence between direct current (DC) panel nameplate ratings and alternating current (AC) grid interconnection capacities. Regardless of which accounting boundary is applied, solar additions measured in hundreds of gigawatts annually dwarf nuclear’s modest net gains.
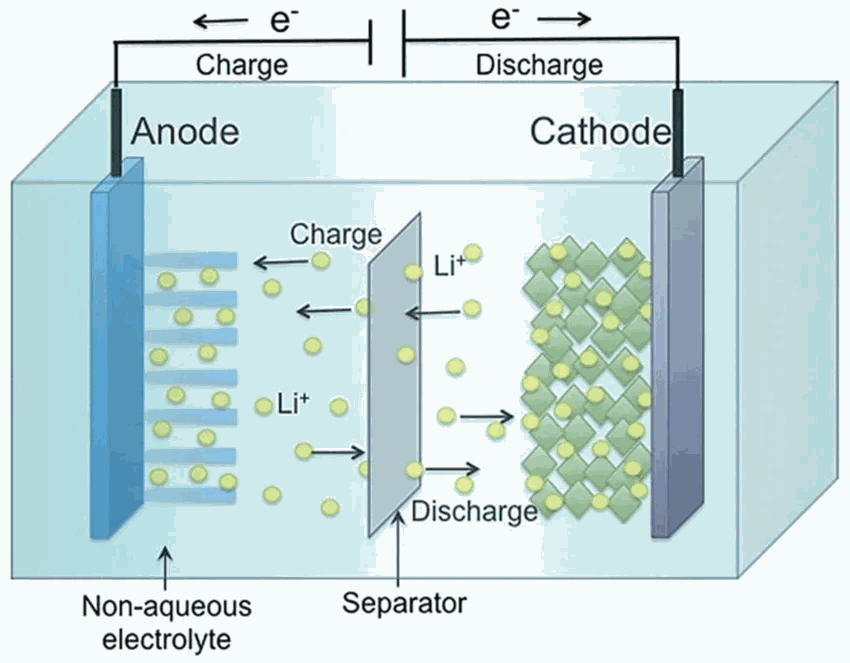
Nuclear energy’s traditional trump card has always been around-the-clock dispatchability during nighttime and overcast spells, but utility-scale battery storage is rapidly filling that void. In 2025 alone, the world added 104 GW and 257 GWh (gigawatt-hours, millions of kilowatt-hours) of battery energy storage, with over 78% of cumulative operating capacity built between 2023 and 2025. Compounding modular manufacturing allows solar and storage to scale on a monthly basis, while nuclear remains encumbered by projects where all 16 recent grid connections were delayed by an average of 10.9 years. The underlying physics and energy density of the nuclear reactor remain unmatched; what has slowed the technology down is a breakdown in construction discipline and capital efficiency.
References:
- WNISR 2026 Global Launch Media Briefing (World Nuclear Industry Status Report 2026)
- pv magazine: Solar surpasses nuclear power globally for first time
- Hacker News Discussion